Diagnostic Comparison Figures
Index
Figure 1: 500 hPa Height
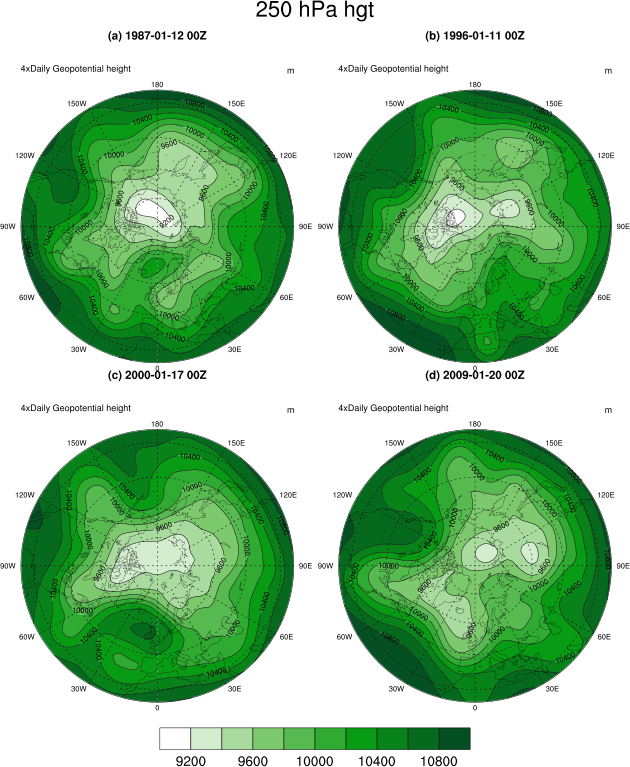
Figure 2: Zonal wind over time
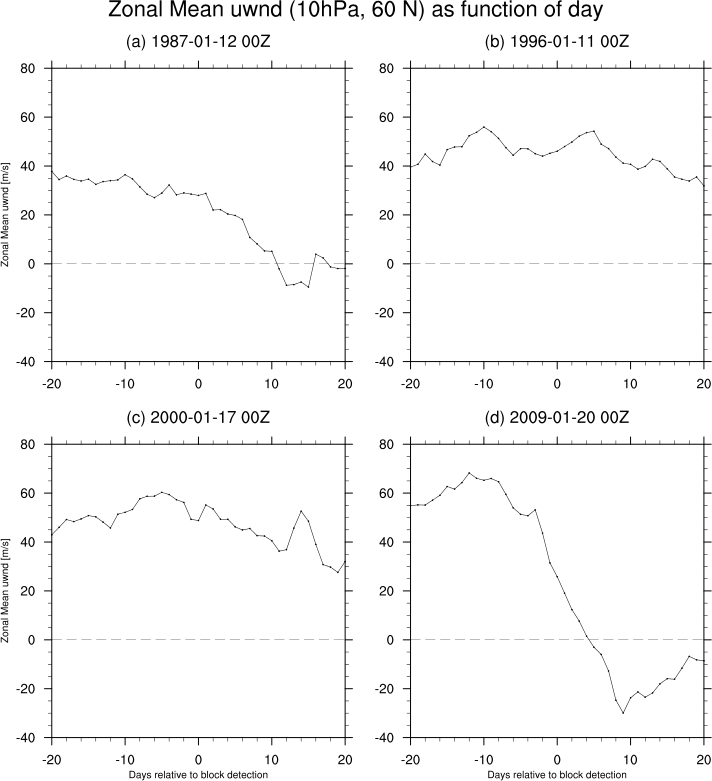
Figure 2 adapted: Zonal wind over time with common axis
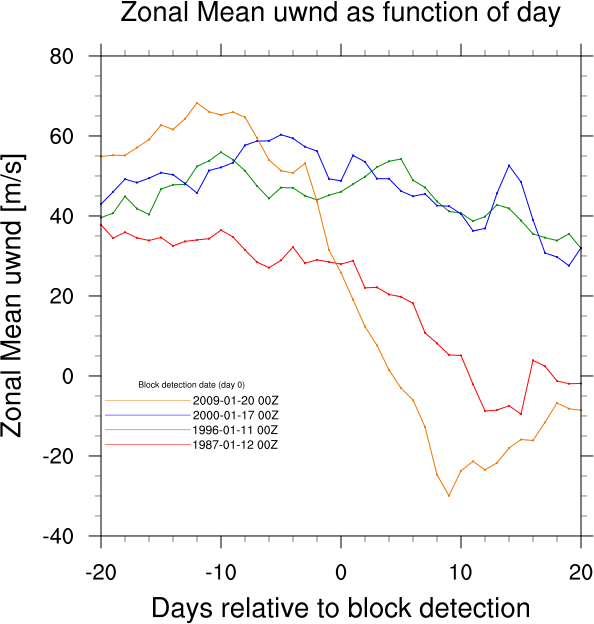
Figure 3: Eddy heat flux
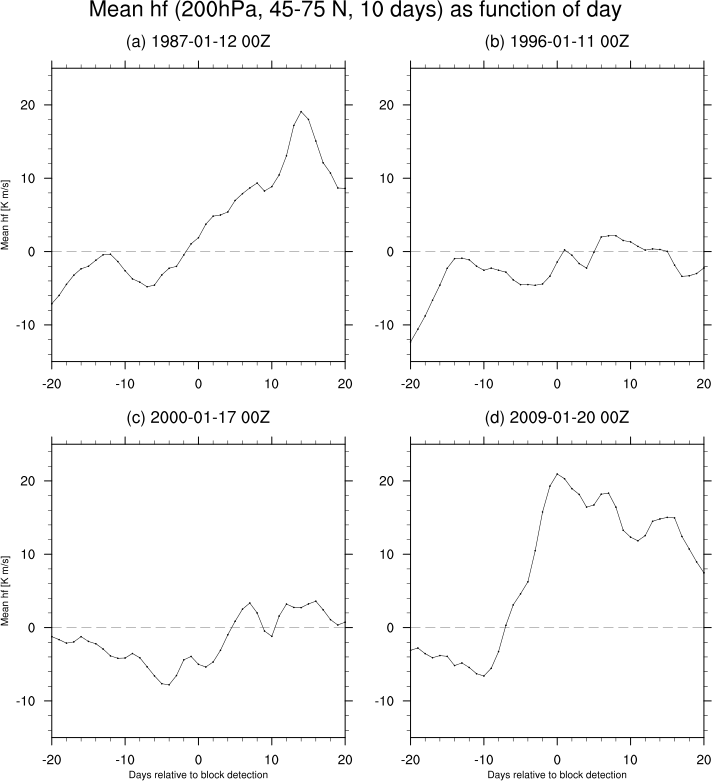
Figure 3 adapted: Eddy heat flux with common axis
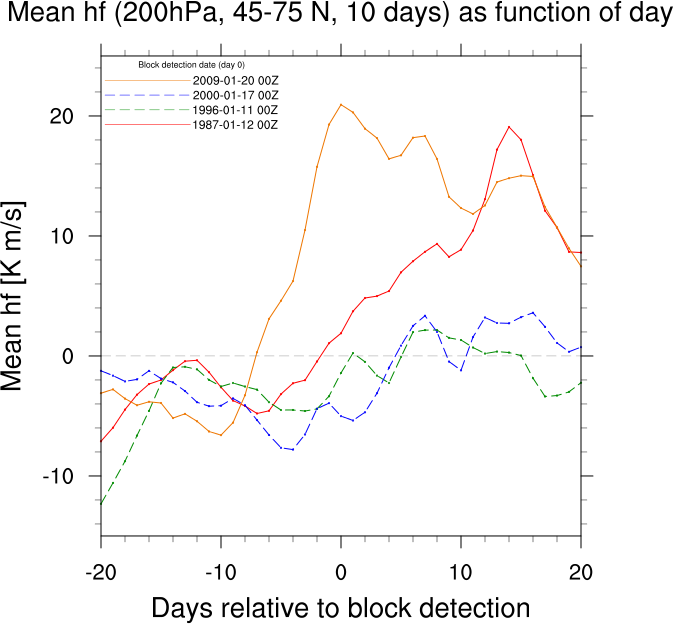
Figure 4: Wave activity flux 30 hPa
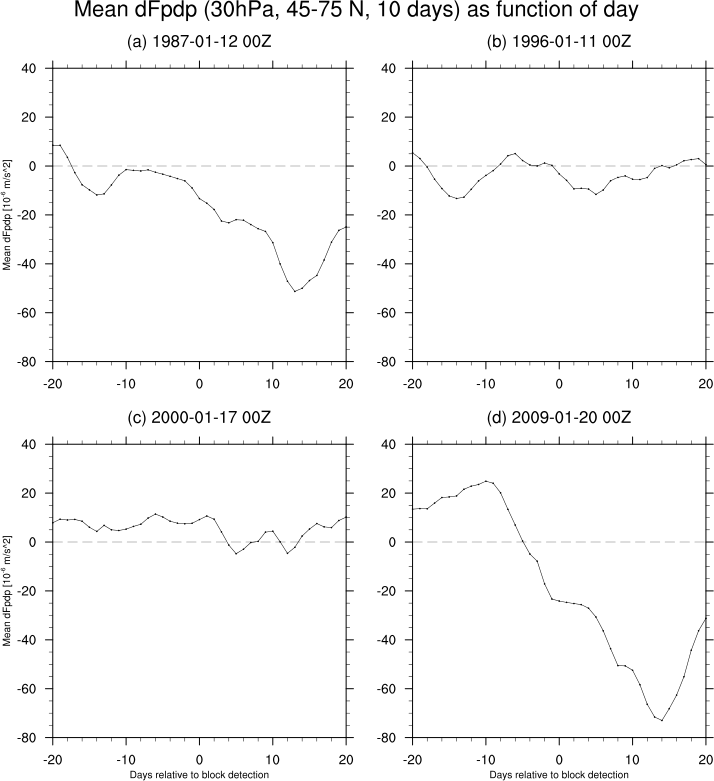
Figure 4 adapted: Wave activity flux 30 hPa common axis

Figure 6: Analyzed 30 hPa height/ height tendancy

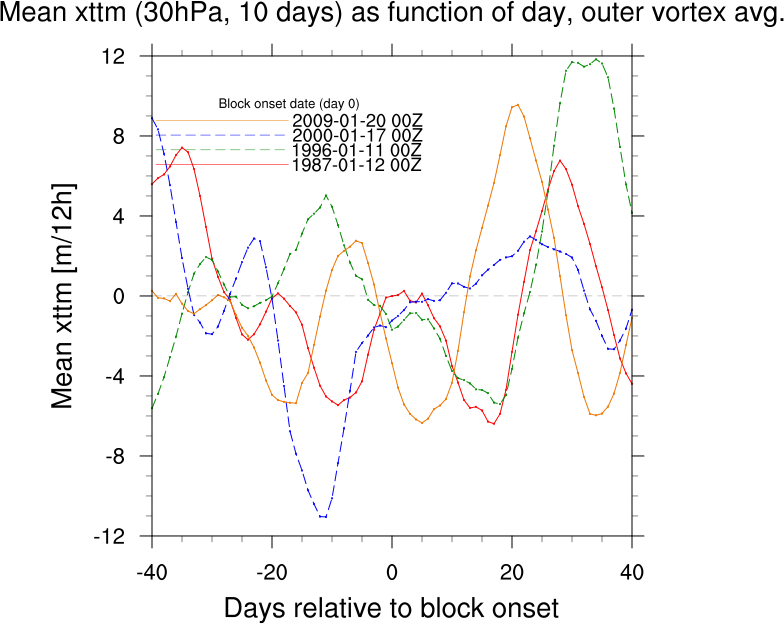
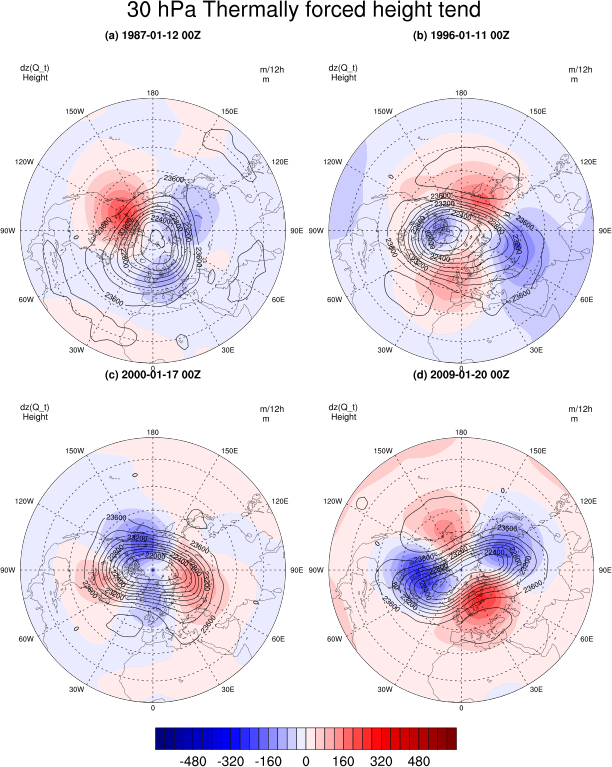
Figure 7: thermally forced ten-day change in 30-mb geopotential height
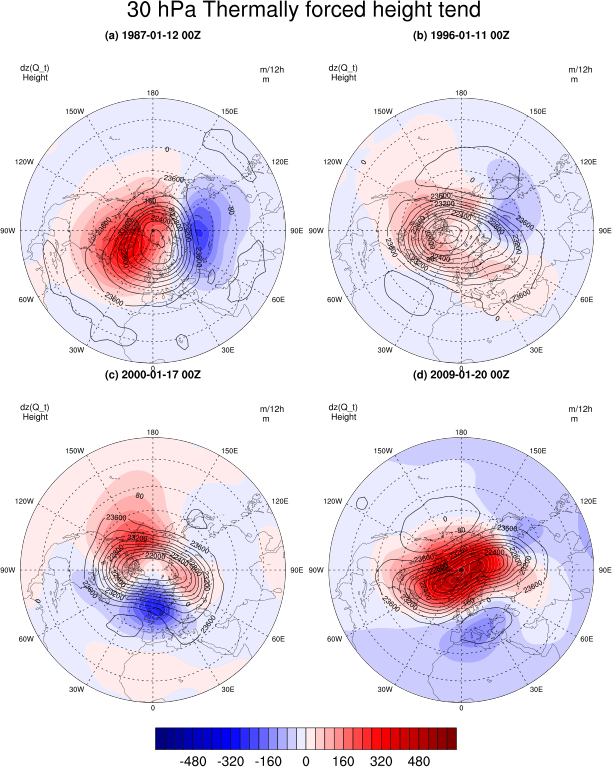
Figure 7, but 10 days prior to onset (avg of day -15 -- -5)
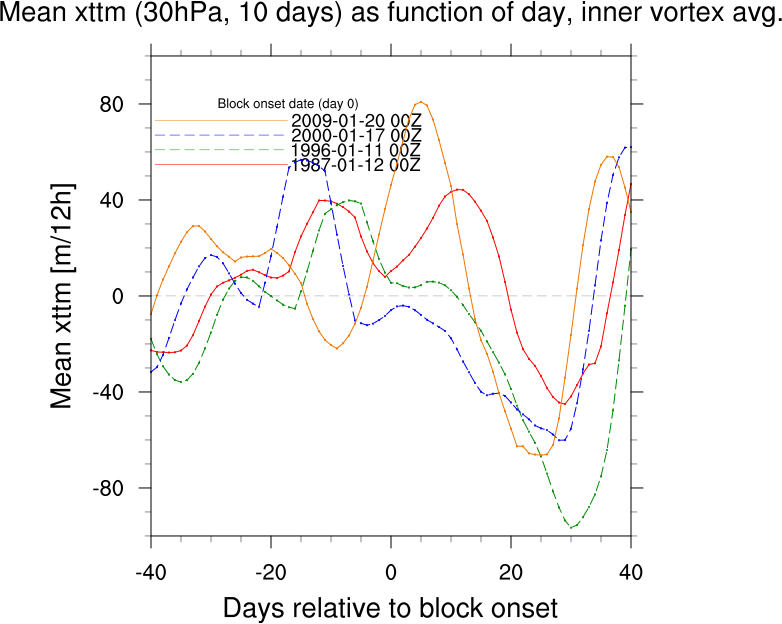
Vortex-averaging of Height tendency
Vortex-averaging of Height tendency (outside vortex)